Part II. Leading Indicators – Oscillators

Commander in Pips: So, today we will talk about leading indicators. First we will discuss the common approach – which indicators usually treated as “leading”. Then we will explain why it is not quite correct and give us better understanding about “leading” term of indicators.
Pipruit: That’s nice.
Commander in Pips:
So, let’s plot three oscillators that we’ve discussed in previous part and see, what kind of signals they generate. These will be RSI, Parabolic SAR and Stochastic:
Chart #1 | GBP/USD Weekly, RSI, Stochastic and Parabolic SAR
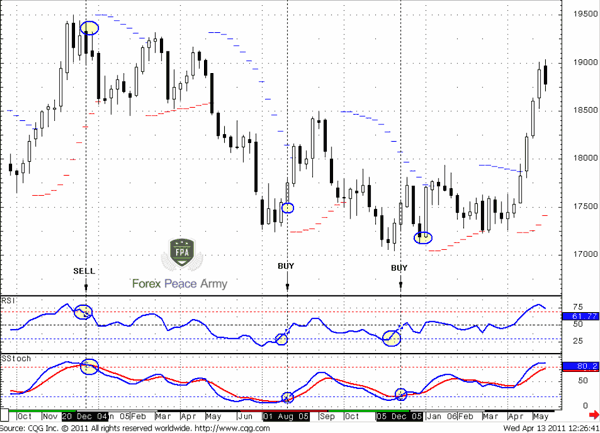
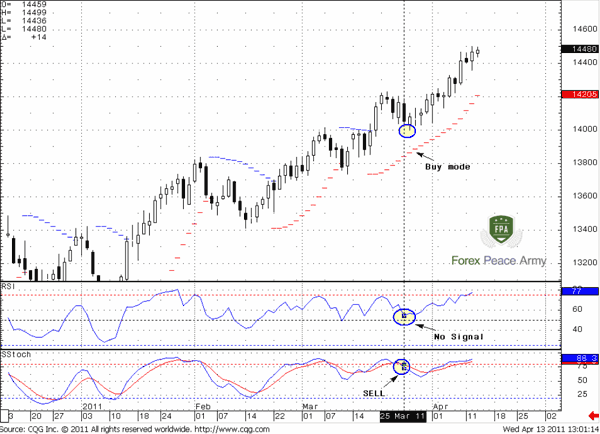
But sometimes they could give very confusing and conflicting signals. Take a look at chart #2. If you have intended to follow these signals, you at least have been confused by them. Stochastic comes out from overbought area and gives sell signal, RSI stays flat, while Parabolic SAR shows Buy mode.
Pipruit: And why is it that way?
Pipruit: And so what?
Chart #2 | EUR/USD Weekly, RSI, Stochastic and Parabolic SAR
Pipruit: Ok, I’ve got it. But, Commander, I do not like this kind of leadership very much. I suppose that it’s better to avoid it. Or, rather, we can use oscillators, even have to use, I might say, but not rely on their leadership properties too much.
Ok, since we’ve finished with common approach of indicators leadership - now we will discuss the correct thoughts, at least I think that they are correct.
Pipruit: Cool, let’s get started…
Correct leading indicators and tools
Commander in Pips: Ok, before we will start, answer one very simple question – how do you imagine the perfect leading indicator?
Commander in Pips: Oh, some hope! I think you will get such indicator if you will get a job in with the Fed Reserve, near its chairman. But in general you’re right. That is what we want from an ideal leading indicator. Unfortunately such kind of indicator does not exist. But there are some trading tools that have one or another property of such indicator.
But before we will discuss them, I just want to note, why I do not recognize oscillators as leading indicators. Because they need price action before they will give signal, and this signal changes with each price tick. How then we could call them “leading” as they only response to past price action, even if they do it fast? All oscillators from my view of categorization are lagging. And what are leading indicators then?
Leading indicators of support resistance
1. Fibonacci retracement levels. Since any retracement has started – price action will hold inside the initial swing that uses for Fib retracement levels calculation. Hence, these levels will stand unchanged during the whole time of retracement. So – we know where will be potential support or resistance ahead of time and these levels do not depend on price action during retracement. This is a leading indicator.
2. Classic support and resistance lines. Here is the same issue – previous extremes and other areas, where market has changed direction will act as support and resistance. So we know them in advance also. They are not as good as Fib retracements, but still, they are leading indicators.
Commander in Pips: I think so. Although personally I do not use trend lines much, in fact, they could be used in this manner. They are also a type of leading indicator – you have the speed of trend line, so you may calculate its value at any time in the future. So the third is:
3. Trend lines – as horizon as slope.
What else?
Commander in Pips: Well done, you’re absolutely right.
4. Fib extensions. By using them, we can easily estimate the targets (when C point has been formed already in AB-CD pattern), and despite the follows price action – extensions will be stable and ahead of time from current price action.
Commander in Pips: There are some.
1. Detrended oscillator (DOSC) and Momentum Indicator. You may use it for estimation of future levels of overbought and oversold. If you do not remember, what DOSC or Momentum is – revisit the corresponding chapter.
Commander in Pips: That’s right. If you remember, we use historical extreme values of momentum as levels of overbought and oversold on the market. Other words, when momentum reaches this level, we treat market as overbought an oversold, right?
Commander in Pips: So, you know these extreme levels ahead of time since they are historical, and because they are relatively stable. Close price n-period ago you know as well. So, you easily can estimate what close price should be today at which market will reach an overbought or oversold level…
Pipruit: Wow, and this is really true. How I can’t get it by myself. So, then we get the formula as follows:
Commander in Pips: That’s right, so you know even before the start of today’s trading session, at which level market will be overbought or oversold. And you could apply it at any time frame!
The same calculation you may do with DOSC indicator.
Commander in Pips: The next indicators are not spread wide, only some expensive software programs (such as CQG, Genesis Trade Navigator and some others) have them, but still they exist:
2. DiNapoli Oscillator predictor (OscP). This indicator shows levels of overbought and oversold one period ahead of time. It looks very akin to Bollinger Bands indicator, but they are not the same, because they have absolutely different math. Here is what it looks like:
Commander in Pips:
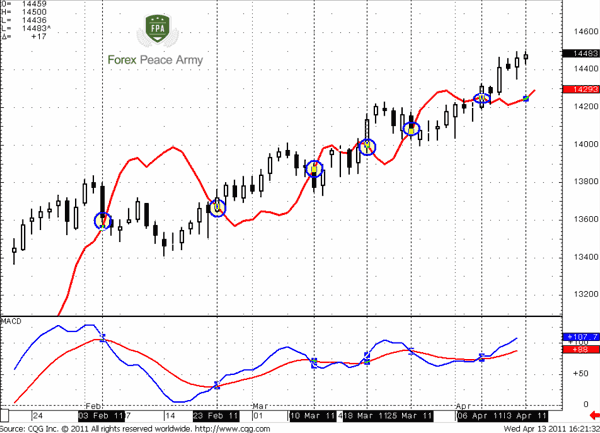
3. DiNapoli MACD Predictor (MACDP). This is derivative indicator from simple MACD. It shows the precise price at which MACD will show line crossing and trend shifting. Also this level is known 1 period ahead of time. Look at chart #4 – when MACD shows trend shifting by line crossing, the red line (that is MACDP) crosses the chart line. So, MACDP shows 1 period ahead of time the price level at which the trend will shift due MACD indicator.
Although may be you will not be able to get OscP and MACDP, still you may use most part of them. Fib retracement and extensions are available for you, so are trend lines. Also you may apply formula that we’ve specified, for estimation oversold and overbought price with Momentum indicator.
This lesson in Forex Military School owes a great deal to Joe DiNapoli's methods, and uses a number of Joe's proprietary indicators. Trademarks and Copyrights: Oscillator Predictor, MACD Predictor are trademarks of Coast Investment Software Inc.
Correct leading indicators and tools
Commander in Pips: Ok, before we will start, answer one very simple question – how do you imagine the perfect leading indicator?
Pipruit: Well, It should show trend shift ahead of time with 100% probability, and generate a signal in advance of current price action. Also, since a signal has been generated, it should not be impacted by following price action.
But before we will discuss them, I just want to note, why I do not recognize oscillators as leading indicators. Because they need price action before they will give signal, and this signal changes with each price tick. How then we could call them “leading” as they only response to past price action, even if they do it fast? All oscillators from my view of categorization are lagging. And what are leading indicators then?
Leading indicators of support resistance
1. Fibonacci retracement levels. Since any retracement has started – price action will hold inside the initial swing that uses for Fib retracement levels calculation. Hence, these levels will stand unchanged during the whole time of retracement. So – we know where will be potential support or resistance ahead of time and these levels do not depend on price action during retracement. This is a leading indicator.
2. Classic support and resistance lines. Here is the same issue – previous extremes and other areas, where market has changed direction will act as support and resistance. So we know them in advance also. They are not as good as Fib retracements, but still, they are leading indicators.
Pipruit: So, does it mean that we could use a trend line as a leading indicator of potential support or resistance?
3. Trend lines – as horizon as slope.
What else?
Pipruit: Well, maybe Fib extensions. They also could lead to support or resistance at their target.
4. Fib extensions. By using them, we can easily estimate the targets (when C point has been formed already in AB-CD pattern), and despite the follows price action – extensions will be stable and ahead of time from current price action.
Pipruit: Ok, I see. So, there are not any leading indicators, I mean oscillators or something like that?
1. Detrended oscillator (DOSC) and Momentum Indicator. You may use it for estimation of future levels of overbought and oversold. If you do not remember, what DOSC or Momentum is – revisit the corresponding chapter.
Pipruit: Commander, I remember what DOSC and Momentum are, and how to apply them. But why is it a leading indicator? Where is its leadership?
Pipruit: Right, and what then?
Pipruit: Wow, and this is really true. How I can’t get it by myself. So, then we get the formula as follows:
Today close price = Momentum extreme level (known) + Close n-periods ago (known).
The same calculation you may do with DOSC indicator.
Commander in Pips: The next indicators are not spread wide, only some expensive software programs (such as CQG, Genesis Trade Navigator and some others) have them, but still they exist:
2. DiNapoli Oscillator predictor (OscP). This indicator shows levels of overbought and oversold one period ahead of time. It looks very akin to Bollinger Bands indicator, but they are not the same, because they have absolutely different math. Here is what it looks like:
Chart #3 | EUR/USD Daily and DiNapoli Oscillator Predictor
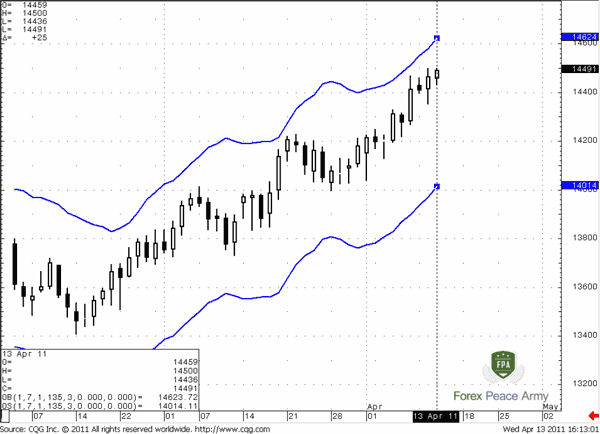
See, the current session is not over yet, but the oscillator already shows levels of overbought (OB) and oversold (OS) for today’s trading day. You can see them in the left bottom corner – OB = 1.4623 and OS = 1.4014. And these levels will remain stable during the whole day, despite price action. Now imagine that you use this oscillator on weekly or monthly time frame? You have levels that hold constant during the whole week/month and where the market will meet resistance or support if it will get there. So, this is also a leading indicator.Commander in Pips:
3. DiNapoli MACD Predictor (MACDP). This is derivative indicator from simple MACD. It shows the precise price at which MACD will show line crossing and trend shifting. Also this level is known 1 period ahead of time. Look at chart #4 – when MACD shows trend shifting by line crossing, the red line (that is MACDP) crosses the chart line. So, MACDP shows 1 period ahead of time the price level at which the trend will shift due MACD indicator.
Chart #4 | EUR/USD Daily and DiNapoli MACD Predictor
So, as you can see my approach to leadership is quite different to the common one. I need indicators that really have some leadership properties – be stable ahead of time despite at the most recent price action. So, using them, I know ahead of time – where will support stand, at which price will the market be overbought or oversold and when a trend will shift. These are leading indicators.Although may be you will not be able to get OscP and MACDP, still you may use most part of them. Fib retracement and extensions are available for you, so are trend lines. Also you may apply formula that we’ve specified, for estimation oversold and overbought price with Momentum indicator.
This lesson in Forex Military School owes a great deal to Joe DiNapoli's methods, and uses a number of Joe's proprietary indicators. Trademarks and Copyrights: Oscillator Predictor, MACD Predictor are trademarks of Coast Investment Software Inc.
Comments

rashidin5178
12 years ago,
Registered user
Pivot Level?
Hi Sive,
Here you do not mentioned about pivot level for leading indicator? Is it pivot level does not in leading indicator's category?:confused:
Thanks and Best Regards
Hi Sive,
Here you do not mentioned about pivot level for leading indicator? Is it pivot level does not in leading indicator's category?:confused:
Thanks and Best Regards

Sive Morten
12 years ago,
Registered user
> Hi Sive,
Here you do not mentioned about pivot level for leading indicator? Is it pivot level does not in leading indicator's category?:confused:
Thanks and Best Regards
Hi Rashidin,
Thanks, yes, you're right.
I forgot about it, but probably that is good, since pivot chapter ahead. If I post here about pivot - this will be unclear since we have not studied it yet.
But you're right, pivots are leading indicators also.
F
ForexBoss48
6 years ago,
Registered user
Sive one question where can I add the DiNapoli indicators

Hamza Samiullah
6 years ago,
Registered user
Nice Explanation...
O
One-fm
5 years ago,
Registered user
The Dinapoli indicators are great tools, how can I get them for either MT4 or 5?
Table of Contents
- Introduction
- FOREX - What is it ?
- Why FOREX?
- The structure of the FOREX market
- Trading sessions
- Where does the money come from in FOREX?
- Different types of market analysis
- Chart types
- Support and Resistance
- Candlesticks – what are they?
- Mysterious Fibonacci
- Introduction to Moving Averages
- Bollinger Bands
- Leading and Lagging Indicators
- Basic chart patterns
- Pivot points – description and calculation
- Elliot Wave Theory
- Intro to Harmonic Patterns
- Divergence Intro
- Harmonic Approach to Recognizing a Trend Day
- Intro to Breakouts and Fakeouts
- Again about Fundamental Analysis
- Cross Pair – What the Beast is That?
- Multiple Time Frame Intro
- Market Sentiment and COT report
- Dealing with the News
- Let's Start with Carry
- Let’s Meet with Dollar Index
- Intermarket Analysis - Commodities
- Trading Plan Framework – Common Thoughts
- A Bit More About Personality
- Mechanical Trading System Intro
- Tracking Your Performance
- Risk Management Framework
- A Bit More About Leverage
- Why Do We Need Stop-Loss Orders?
- Scaling of Position
- Intramarket Correlations
- Some Talk About Brokers
- Forex Scam - Money Managers
- Graduation!